Why planning accuracy is key to the future of retail
Traditional retailers worldwide are feeling pain. Major brands like Macy’s in the US, Godfreys in Australia, and Smith and Caughey in NZ, which have been around for decades, are closing their doors, citing tough trading conditions, fickle consumers, the impact of online shopping, and, of course, COVID-19.

These are all. of course, real challenges retailers face today, but is something else contributing to the seemingly rapid decline of retail? Working with retailers across ANZ, we can observe first-hand the challenges that contribute to the growing list of struggling companies - and the issue is not necessarily what you think.
Data and process
By ingesting and processing trillions of sales events and external data such as environmental, social and search data, we can see a view of consumer behaviour and company performance that is not ordinarily available to even the most tech-savvy organisations.
When we examined the data closely, we found several common trends across many large ‘traditional’ retailers—if not most. We found the same issues in enough places to indicate something is going on that is worth sharing.
Running a successful retail business
Running a big retail operation is immensely complicated. There are millions of moving parts to keep track of to turn a profit.
The problem, of course, is that when there are millions of moving parts, it’s hard to know where to focus, and it’s easy to lose sight of the things driving bottom-line performance. This problem is compounded as retailers get bigger and supply chains get more complicated.
The key levers that determine whether or not a retailer turns a profit are all well understood - Sales Revenue, Inventory Turnover and Margin Management are all critically important and are tracked (albeit often in siloes) as a lifeline for all retailers.
As businesses become more complex, people become overwhelmed with operational firefighting, leading to a gradual decline in planning accuracy.
"We are surrounded by data, but starved for insights."
Myth busting changing consumer buying behaviour
First, it is commonly held that consumers are shopping in physical retail less frequently, and the resulting lack of footfall is the cause of the sector's macro-decline.
While this may be true for some sectors, blaming all poor performance on this may be too easy; indeed, our case studies tell a different story. Consider the examples of several large ANZ Retailers.
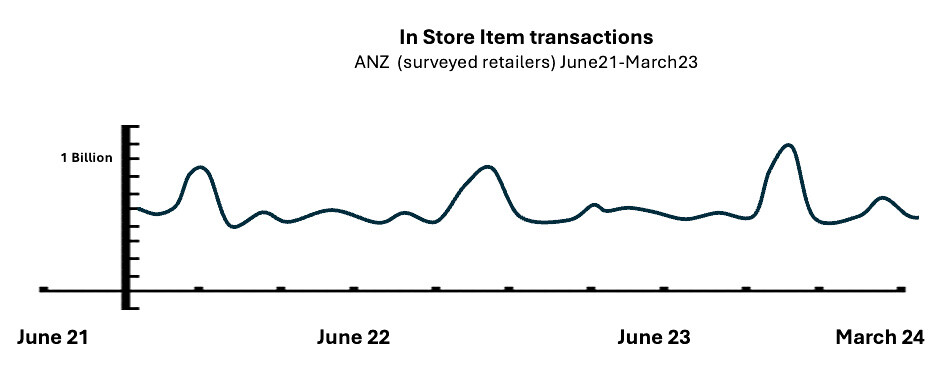
The top chart shows transactional velocity is stable; consumers may still research online more but commit to destination purchases.
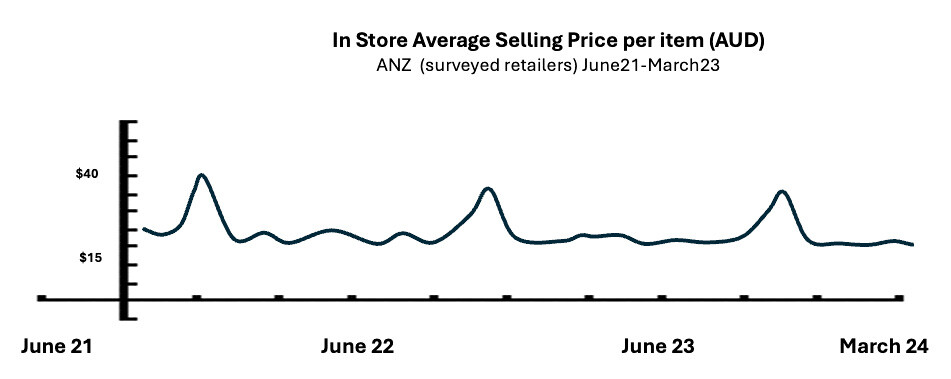
The bottom chart shows that the value per transaction has declined slightly over time, which reduces retailers' top-line revenue—although not by much.
So, the first important point is that retailers aren’t always struggling because people are shopping less. For many categories, business demand may be stable or even growing strongly.
That said, shoppers are undoubtedly using the web to research and are shopping smarter, but the more important issue is that shoppers have been conditioned to shop for discounts late in product life cycles when they are discounted, which impacts retailer margins.
The true cost of stock availability performance
So, what else could be going on if it isn't foot traffic? Customer experience in retail is king and stock availability is a key driver of satisfaction. If stock isn’t available for customers to buy, everyone loses. For this exercise, we define stock availability as a stock item being available to purchase at every location at every trading hour.
The target for stock availability for retailers is 100%. However, the more focus retailers put on this target, the more risk they run of carrying aged or obsolete stock. So, there is a fine balance between customer experience and working capital blowouts.
Continuing with our example for our example Retailer, the chart below shows all stock locations’ availability over time.
"Wouldn’t it be great to have a magic wand that allows you to balance risk of stock availability vs working capital exposure"
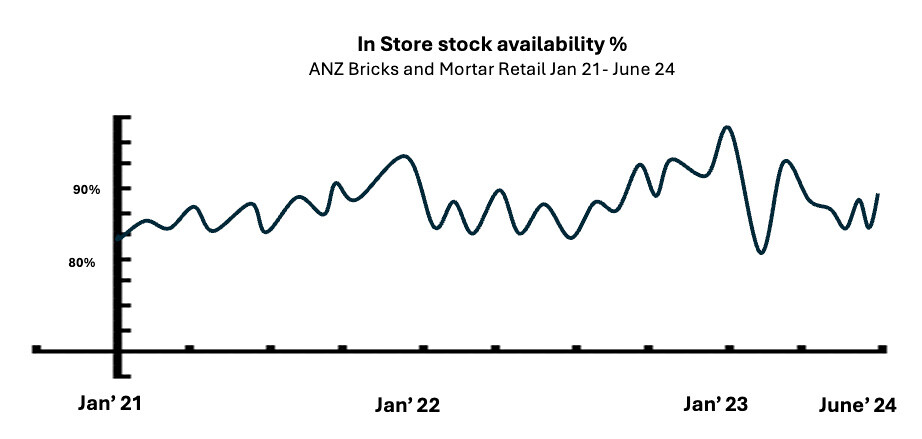
The key takeaway from this graph is that while stock availability is improving over time, during highly promotional periods, we can see a growing decay in availability, which means a higher proportion of products are becoming aged—which is not good. Retailers fear that sales will be lost at times when stores are busiest and that stores will be full of products that customers don’t want to buy.
Capital efficiency starts with good inventory turn
Measuring inventory turnover is the most critical operational measure for any retailer as it indicates how efficient their use of working capital is. The slower the turn, the more inefficient the use of cash. We see it becoming increasingly important to measure inventory turnover at a store level to ensure stock is in the optimal place to sell.
The best practice inventory turn is in the region of 9x (which means all the stock is turned over every 40 days). With a faster stock turn, retailers have less stock sitting around in warehouses and can be far more nimble when there is a requirement to expedite inward goods or clear ageing stock before it becomes obsolete.
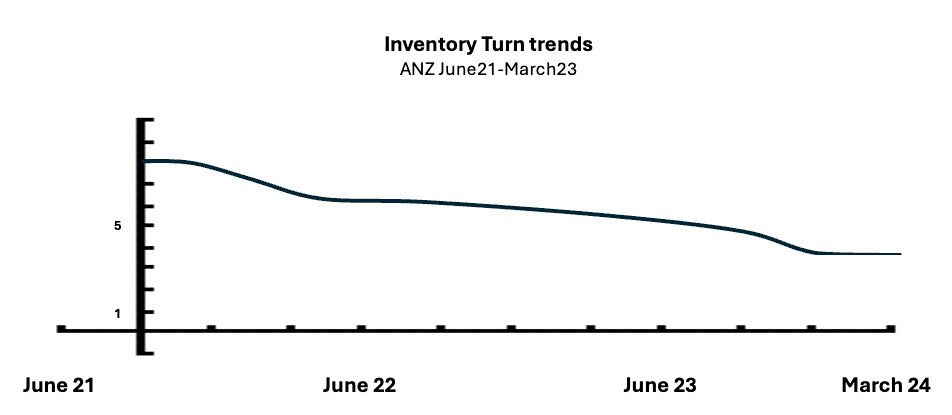
The graph below shows data from various ANZ retailers and provides an essential insight into stock over time. It shows a decline from an average of 3.5 in 2022 to 2.8 in 2024.
The 25% decline has a significant working capital implication and the flexibility to remediate urgent stock issues because cash is tied up in inventory…that isn’t selling.
"We are living through a perfect storm where we are more capital inefficient as the cost of capital increases."
The importance of planning accuracy and the Quantiful effect
Poor operational execution comes from poor planning. The analysis so far shows the systemic effect of gr planning error—both in the short, medium, and long terms. As accuracy declines, all of the metrics that are driven by it (stock turn, stock availability, etc.) start to fall, and gradually, almost silently, the business starts to degrade and decline until, one day, it all goes up in smoke.
So, how do retailers reverse these trends?
AI has a vital role to play. Given the correct training data, AI is not sensitive to large SKU counts or complex distribution networks; Al-driven forecasts will outperform judgemental forecasts at scale and speed. The benefits are more productive planning people focusing on the fringe exceptions instead of firefighting. This means bottom-line benefits and a happy workforce working on strategic initiatives to win markets.
If you ask an AI engine to predict 15 days of demand in 45 days, expect a forecast with 85% accuracy to the SKU location level, which is the “magic wand” that can equalise stock availability and working capital with a high degree of probability. With accurate forecasts, retailers no longer need to hold excess inventory. They can become far more nimble operationally and financially as their working capital dependencies rapidly improve.
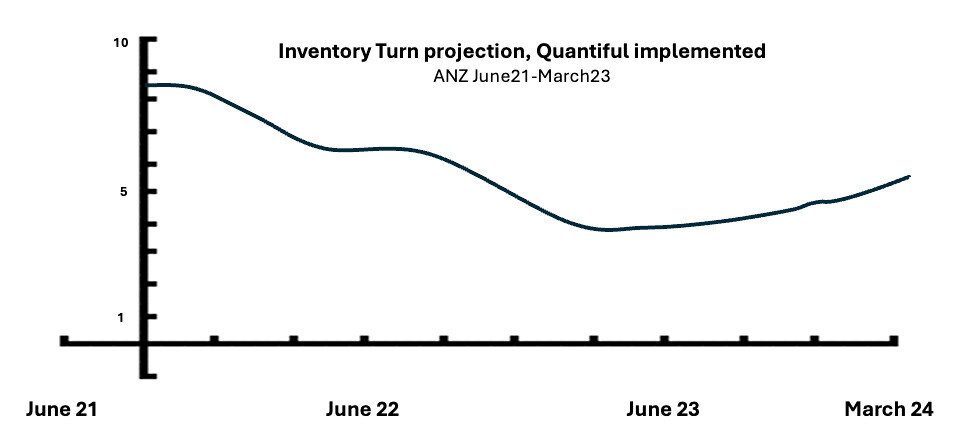
The graph below highlights the effect of better planning, 90% AI forecasts and 10% judgemental on stock turn. In this example, our first goal was to arrest the decline, which Quantiful software did successfully with highly accurate forecasts and automated fulfilment. The next goal is to bend the curve back the other way.
Conclusion
The conclusion to the analysis is clear - until retailers start getting better at planning they will continue to decline, under-deliver and ultimately fail.
It is possible to reverse the trends and fix the problem - but it requires some bold decision making / actions on behalf of IT/Senior Leaders to adopt purpose made technologies that are proven to do the job.
With flexible cloud / SaaS solutions that complement your existing ERP / stack, the barriers to adopting AI-based tools are falling away. To get back to the fundamentals of planning requires AI to do the jobs humans are doing unnecessarily. It may not immediately solve the problem, but if you don’t start now it may well be too late to turn the ship around if you don't start now.